In the 1970’s, the Brookings Institution created a census data-based “Hardship Index” of selected urban ZIP codes across America. These metrics (based on unemployment levels, poverty rates, and educational attainment, among other factors) were used to identify areas of concentrated economic hardship. Recently, UIC’s Great Cities Institute reworked the Brookings formula to map degrees of hardship across Chicago’s 77 community areas, depicting spatial patterns of poverty across the city.
In collaboration with Great Cities Institute, Huff Post contributor Lily Casura took the Index a step further, mapping concentrated hardship for the City of San Antonio, Texas.
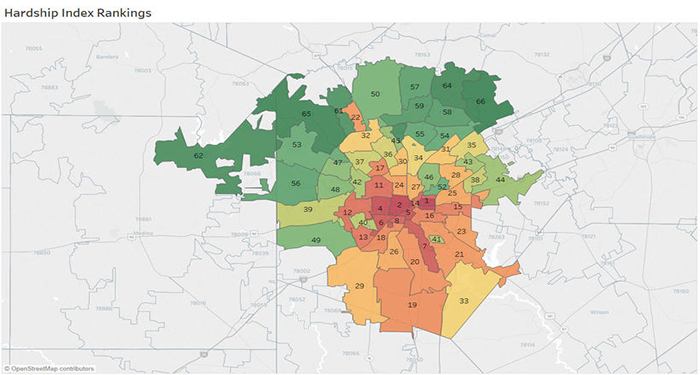
A spatial depiction of San Antonio’s areas of highest hardship.
Source: Lily Casura / Tableau Public.
After creating a series of dozens of maps about various population characteristics in San Antonio by ZIP Code, I used the original Brookings formula to create a comparable hardship index for San Antonio, then ran it by the Chicago researchers to make sure I had it right. The result is above, and it confirms what I had been seeing in map after map of population characteristics.
As described in the previous article in this series, an obvious “crescent of comfort,” or zone of comparative well-being, had become apparent on almost every data map of San Antonio, to the north of the city — with a concentration of much more difficult living to the south, particularly to the immediate west and east of the city center.
Casura’s mapping highlights the connection between present-day high-hardship areas and redlining maps of the 1930’s, showing longstanding patterns of discrimination. She also discusses the impact of economic hardship on community well-being and public health.


