Emanuel: Violence-plagued Chicago needs to bolster ‘moral compass’

A USA Today story about Mayor Rahm Emanuel’s newly announced plan to reduce Chicago violence cites findings from a January 2016 UIC Great Cities Institute report on youth joblessness in Chicago.

An estimated 47% of the city’s black youth, between the ages 20-24, are neither in school nor employed, according to a report from the University of Illinois at Chicago’s Great Cities Institute. Under the new mentoring program, a public-private partnership, all young people in the city’s 20 most impoverished neighborhood would have an opportunity to be mentored.
Full Story from USA Today »

In Chicago, 35,000 people have been murdered in 50 years

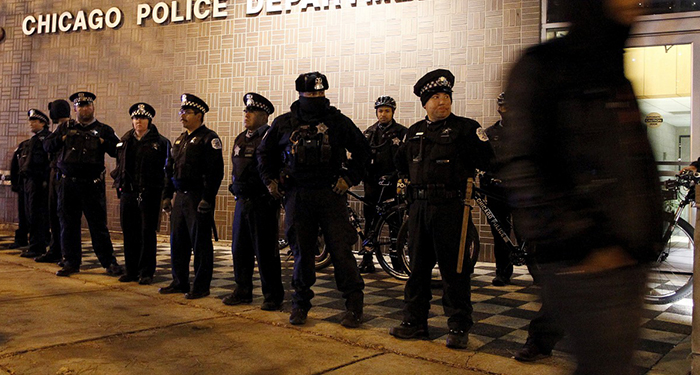
A protester walks past a line of police officers standing guard in front of the District 1 police headquarters in Chicago, Illinois November 24, 2015. Photo by REUTERS/Frank Polich

A protester walks past a line of police officers standing guard in front of the District 1 police headquarters in Chicago, Illinois November 24, 2015. Photo by REUTERS/Frank Polich

A January 2016 UIC Great Cities Institute report on youth joblessness in Chicago is cited in a PBS NewsHour online story about homicides in the city.

Lance Williams is an associate professor of urban affairs at Northeastern Illinois University and a youth advocate. He says Chicago’s latest violent trends also stem from poverty and unemployment. The two combine to leave Chicago’s young black men feeling penned in, he said. Nearly half of Chicago’s black men age 20 to 24 are unemployed, according to a report from the University of Illinois at Chicago’s Great Cities Institute.

“You can hire all of the police that you want, you’re not going to solve this problem because these young men are acting in alignment with their cultural value system,” Williams told the NewsHour in a report that will air Wednesday.

Full Story from PBS NewsHour »

Covering the Gap: The Impact of Economic Inequality

09-19-16 PoyntnerNews

GCI Director Teresa Córdova will participate in a panel for Poynter Journal’s seminar “Covering the Gap: The Impact of Economic Inequality”, October 11-13.

The seminar is:

an intense 2½ -day seminar, is designed to help journalists and their communities explore the economic roots and impacts of some of our country’s most vexing social problems. Thanks to a grant from the McCormick Foundation, 20 journalists from digital, broadcast and print newsrooms will gather in Chicago this Oct. 11-13 to learn from experts and discuss how to better cover this important issue.

For more information on the seminar, visit their website.

Economic hardship index shows stark inequality across Chicago

09-19-16 CCAHardshipIndex

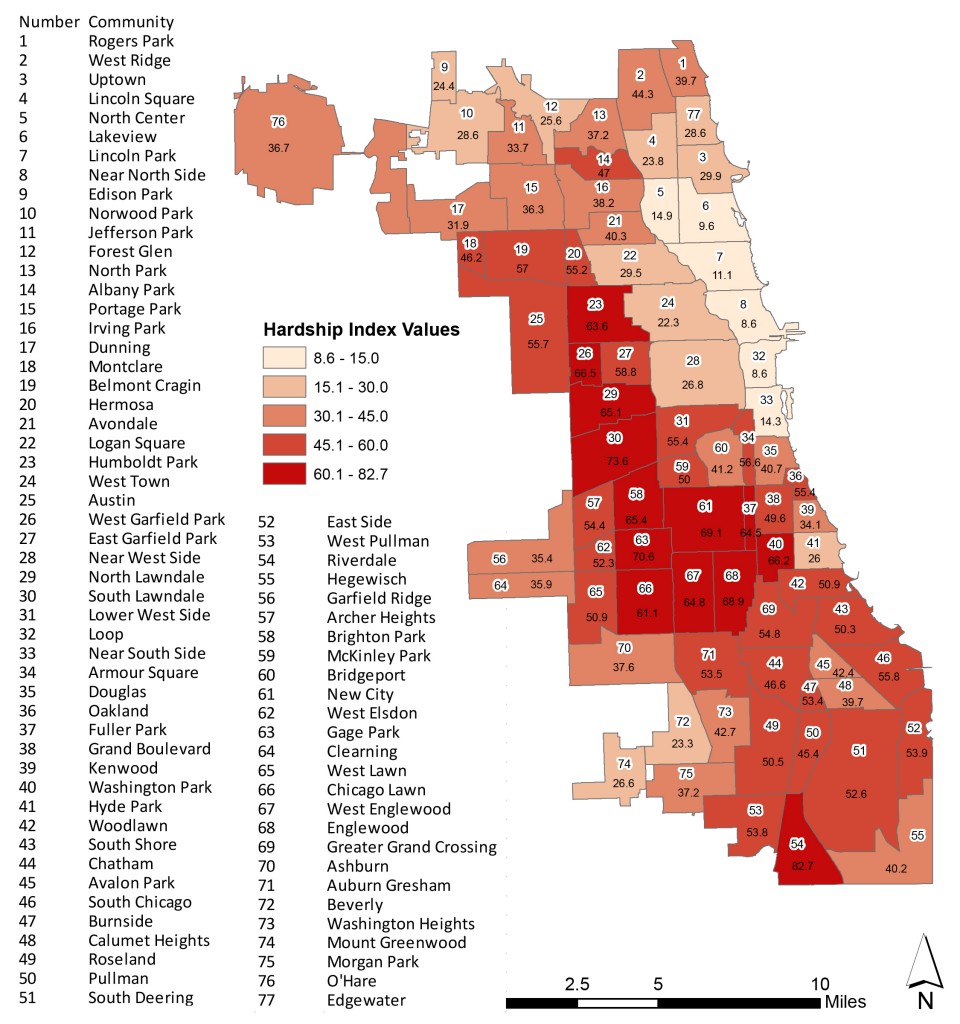
Racial segregation, concentrated poverty, and physical deterioration of neighborhoods continues to define conditions of inequality across Chicago neighborhoods. As economic restructuring has caused a hollowing of the middle-class, stagnant wages, and retrenchment of public spending, many Chicagoans are living in economic conditions far worse than in other parts of the city.

For the next fact sheet in the Great Cities Institute’s Fact Sheet Series, we applied an economic hardship index to Chicago Community Areas to further understand economic disparities across the city. The strength of such an index is in the multiple variables considered which provides a more comprehensive view of economic hardship than single indicators. Combining poverty, income, employment, education, living conditions, and population dependency variables we can understand a range of factors contributing to economic conditions and prospects for upward mobility. The six variables we used to calculate composite economic hardship in the fact sheet include:

  • Unemployment (over the age of 16 years)
  • Education (over 25 years of age without a high school diploma)
  • Per capita income level
  • Poverty (below the federal poverty level)
  • Crowded housing (housing units with more than one person per room)
  • Dependency (population under 18 or over 64 years of age)

The index was developed by Richard P. Nathan and Charles F. Adams Jr in 1976 and has since been applied to cities and regions throughout the U.S. by researchers and policymakers to measure economic hardship. This index has wide application across policy areas due to the interconnectedness of economic factors to overall quality of life. For example, in 2012, this particular index was used by the City of Chicago’s Department of Public Health to understand the neighborhood characteristics that impact health outcomes and behaviors.

It is our hope that this hardship index will contribute to the understanding of urban issues and provide our civic and community partners with information to improve the quality of life in Chicago.

Data highlights from the factsheet include:

  • The Loop (8.6 hardship index score), Near North Side (8.6) and Lakeview (9.6) had the three lowest hardship index values.
  • The Community areas with the next three lowest Index scores were Lincoln Park (11.1), the Near South Side (14.3), and North Center (14.9). The six Community areas with the lowest hardship index scores share boarders.
  • The five Community Areas with the lowest hardship index scores, The Loop, Near North Side, Near South Side, Lincoln Park, and Lakeview are all located along Lake Michigan.
  • The Community Areas with the highest hardship index scores are Riverdale on the far south side (82.7 hardship index score), and Gage Park (70.6) and South Lawndale (73.6) on the Southwest side.
  • The Near West Side (26.8 hardship index score), West Town (22.3) and Logan Square (29.5) boarder the areas with lowest hardship index scores to their east. Some of the highest index scores in Chicago were located to the west including Humboldt Park (63.6), East Garfield Park (58.8) North Lawndale (65.1), and South Lawndale (73.6).
  • A cluster of Community Areas on the South and Southwest Sides of Chicago had among the highest hardship index scores in the city. The cluster of Community Areas which had high hardship index score included Washington Park (66.2 hardship score), Fuller Park (64.5), New City (69.1), Brighton Park (65.4), Englewood (68.8), West Englewood (64.8), and Gage Park (70.6).
  • The Pullman Community Area had the median hardship index value (45.4) for all Community Areas. In addition to the index calculations, Community Area level data for each variable is included in the factsheet.

Please stay tuned for our forthcoming report on economic hardship.

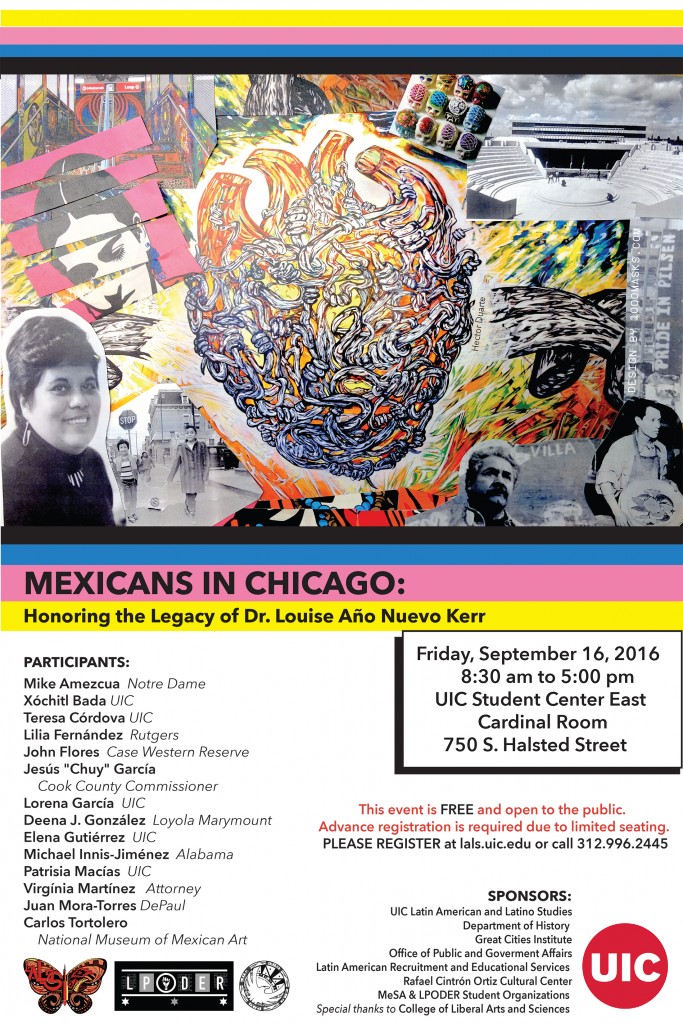
Mexicans in Chicago: Honoring the Legacy of Dr. Louise Año Nuevo Kerr

MICPOSTERCleansmall


Event Photos


Summary


A special one-day conference
Student Center East
Cardinal Room

Space is limited. Lunch will be provided. Please register here.

September 16, 2016
8:30 – 9:00 Registration and Breakfast
9:00 – 9:15 Welcome
9:15 – 10:00 Opening Keynote
10:15 – 12:15 Mexicans in Chicago before 1945
12:15 – 1:45 Lunch
1:45 – 3:45 Mexicans in Chicago since 1945
4:00 – 4:45 Closing Keynote
4:45 – 5:00 Closing

Dr. Año Nuevo Kerr was a pioneering scholar in her field and made a lasting impact on dozens of students and colleagues. Her dissertation, The Chicano Experience in Chicago: 1920 – 1970, was a breakthrough in the study of people of Mexican descent in the midwest. She served for nearly 10 years in academic and administrative roles at UIC, eventually becoming the Associate Vice Chancellor for Academic Affairs.

Sponsors:
UIC Latin American and Latino Studies Program
Great Cities Institute
Department of History
Latin American Recruitment and Educational Services
Office of Public and Government Affairs
Rafael Cintrón Ortiz Latino Cultural Center
Latino Planning Organization for Development, Education, and Regeneration (LPODER)
Mexican Students de Aztlan (MeSA)

Special thanks for generous support from the College of Liberal Arts and Sciences.

For more information and to register please visit: http://lals.uic.edu/lals/mexicans-in-chicago


Categories:

2016 UIC Urban Forum

SAVE THE DATE: 2016 UIC Urban Forum

Jobs and the Labor Force of Tomorrow: Migration, Training, Education
September 15, 2016

Dynamic metropolitan economies require a diverse, trained and available work force that adapts to the needs of commerce, industry, government and the service sector today as well as in the future. The rapidly changing economy demands that the workforce be adaptable and flexible by continuously increasingly skill levels, providing training opportunities, and recognizing the quick pace of job shifting. The quality of the workforce and supply of human capital in US urban areas have been shaped by a variety of forces throughout the industrial and post-industrial eras, most notably the enactment of compulsory public education, inducement of internal migration, massive demands for a rapidly increasing workforce via immigration, and the enactment of public policy regulations concerning wages, working conditions and collective bargaining. The 2016 Urban Forum focuses the lenses on human capital development to address the contemporary challenges that shape human capital in metropolitan regions by examining the role of migration and immigration, K-12 education preparedness, post-secondary workforce training and development efforts, and recruitment and professional development of Millennials.

White papers for the 2016 UIC Urban Forum:
The Overview White Paper.
Nik Theodore, University of Illinois at Chicago

White Paper 1: Migration/Immigration
Xóchitl Bada, University of Illinois at Chicago

White Paper 2: Post-secondary education
Gregory Larnell, University of Illinois at Chicago

White Paper 3: Jobs, Wages, working conditions and public policy.
Laura Dresser, University of Wisconsin at Madison

White Paper 4: Continuous professional development and Millennials.
Brad Harrington, Boston College

For full abstracts on the white papers visit www.uicurbanforum.org.

Categories:

Using GCI data, the Chicago Tribune continues focus on youth employment

Last week, the Chicago Tribune utilized a new data report prepared by GCI in the article “Chicago tackles youth unemployment as it wrestles with its consequences.“ The report was utilized to determine which neighborhoods experienced short-term changes in youth employment. In neighborhoods with short-term changes, the article’s author, Alexia Elejalde-Ruiz, explores the community conditions and practices surrounding the local employment conditions.

The Tribune piece tells stories of youth, their challenges to find employment and chronicles how conditions such as neighborhood population loss, diminishing resources for the vulnerable and impoverished, neighborhood perceptions, and lack of large-scale training programs have contributed to the crisis of youth unemployment. The article then identifies job training, education, and placement programs along with direct employers whose efforts have positively impacted youth throughout Chicago’s neighborhoods most in need.

The new GCI report builds upon previous reports, “Lost: The Crisis Of Jobless and Out Of School Teens and Young Adults in Chicago, Illinois and the U.S.,” and, “A Lost Generation: The Disappearance of Teens and Young Adults from the Job Market in Cook County.” In contrast to previous reports, which examined 2014 employment data for 16 to 24 year olds in Chicago Community Areas, this new report examines employment data in Chicago Community Areas over time.

Highlights from the data report titled, “Youth Employment Data: Employment to Population Ratios for 16 to 19 and 20 to 24 Year Olds by Chicago Community Area, 2005-2009 to 2010-2014,” for 16 to 19 year olds include:

  • The Near South Side and Burnside had the largest percentage point increases from 2005-2009 to 2010-2014 in employment to population ratios for 16 to 19 year olds in which the Near South Side increased 24.3 and Burnside increased 28 percentage points.
  • The South Side communities with the largest percentage point increases of employment to population ratio for 20 to 24 year olds from 2005-2009 to 2010-2014 were Oakland (+4.8), Armour Square (+4.1), Englewood (+3.7), Kenwood (+2.6) and Washington Heights (+.4)
  • The West and Southwest Side Community Areas with the largest percentage point increases of employment to population ratio for 20 to 24 year olds from 2005-2009 to 2010-2014 were McKinley Park (-16.9), Clearing (-14.5), East Garfield Park (-13.9), Gage Park (-12.6), and the Lower West Side (-10.7).

For 20 to 24 Year olds:

  • The largest percentage point increases in employment to population ratios for 20 to 24 year olds from 2005-2009 to 2010-2014 for West Side Community Community Areas were Humboldt Park (+4), Hermosa (+5.6), West Garfield Park (+3), the Near West Side (+4), and West Town (+5).
  • The North Side Community Areas with the largest percentage point increases of employment to population ratio for 20 to 24 year olds from 2005-2009 to 2010-2014 included the Near North Side (+6.7), Lincoln Park (+6.6), Uptown (+2.7), and North Park (+3.1).
  • The largest percentage point increases in employment to population ratios for 20 to 24 year olds from 2005-2009 to 2010-2014 for South Side Community Areas were Fuller Park (-19.1), Oakland (-25.4), Douglas (-14.4), Grand Boulevard (-12.3), Kenwood (-12.5), South Shore (-9.4), Hyde Park (-10.5), and Englewood (-10.6).

We are excited that the Chicago Tribune continues its interest in this very important issue. We welcome others to continue their use of our reports for advocacy, grant writing, and further research to improve the quality of life in our cities and regions.

Chicago tackles youth unemployment as it wrestles with its consequences

(Zbigniew Bzdak / Chicago Tribune) Young men walk after school under a Metra viaduct at 113th Street in Chicago's Pullman neighborhood in 2014. As violence has surged in some of the city's neighborhoods, the issue of youth joblessness has taken on renewed urgency.

(Zbigniew Bzdak / Chicago Tribune)
Young men walk after school under a Metra viaduct at 113th Street in Chicago’s Pullman neighborhood in 2014. As violence has surged in some of the city’s neighborhoods, the issue of youth joblessness has taken on renewed urgency.

A new Great Cities Institute data report on youth employment was cited by the Chicago Tribune in an article on Chicago’s efforts to reduce youth unemployment.

Some data suggest youth unemployment could be worsening, even in neighborhoods like Bronzeville that are seeing new life and new jobs.

Between 2009 and 2014, when much of the country was recovering from the Great Recession, the employment rate among 20- to 24-year-olds fell by double digits in Bronzeville and several other neighborhoods mostly on the city’s South and West sides, according to data analyzed for the Tribune by the University of Illinois at Chicago‘s Great Cities Institute.

The employment rate, which is the share of the population that is working (not counting those who are imprisoned or institutionalized), is often considered a better measure of the labor market than the unemployment rate, which only counts jobless people who are looking for work and not those who have given up.

Full Story from Chicago Tribune »
View the Report »

Youth Employment Data: Employment to Population Ratios for 16 to 19 and 20 to 24 Year Olds by Chicago Community Area, 2005-2009 to 2010-2014

Author
Matthew D. Wilson

Abstract
Issues of youth employment have gained much attention in Chicago as the number of youth without Jobs has hit historic highs in recent years. As shown in the recent report prepared by the Great Cities Institute, “Lost: The Crisis Of Jobless and Out Of School Teens and Young Adults in Chicago, Illinois and the U.S.,” issues of youth joblessness are chronic and concentrated in Chicago Community Areas with the highest populations of Black residents. Chicago has higher percentages of Black and Latino youth without employment than the U.S., Illinois, Los Angeles, and New York.

In collaboration with The Chicago Tribune, this analysis by the Great Cities Institute examines by Chicago Community Area recent employment trends to identify which areas have experienced improvement in youth employment conditions. The analysis covers 5 years of employment trends for 16 to 19 and 20 to 24 year olds by Chicago Community Area to show the improving and declining employment conditions (see “Data Highlights on pages 3 and 4). With the identification of specific Community Areas, further investigation can uncover the conditions that explain the improving youth employment.

Full Text PDF »